Commentary From Our Investment Team
As Interest Rates Climb, are Bonds Still a Good Investment?
“The best protection against inflation is your own personal earning power. . . If you do something valuable and good for society, it doesn’t matter what the U.S. dollar does.” – Warren Buffett
The Federal Reserve has two main goals: to keep unemployment low and keep inflation low. They have basically one tool for achieving this: setting interest rates. Lately, unemployment has been low, but inflation has been running at its highest level in more than 40 years. Consequently, to bring it down by putting a damper on the economy, the Fed has continued its policy of increasing interest rates.
This course of action was seen as inevitable by those who believed the current round of inflation was not as “temporary and transitory” as many had hoped. As a result of this tightening of the money supply the stock market responded with a series of corrections which has resulted in another quarter of losses for all the major indexes.
Whether this latest round of rate hikes will finally slow inflation is yet to be seen. It certainly has participated in bringing down the prices of stocks. For this reason, those who believe the market will eventually return to its long-term trend of growth have been purchasing equities at a discount.
However, stocks are not the only widely traded instrument available to investors. Bonds are also a key component of a diverse portfolio. While they too have suffered under rising rates, they have a built-in mechanism which dampens their volatility.
The Bond Teeter-Totter
Bonds are instruments of debt instead of equity (like stocks) and have two components, which is why people often find them confusing. A bond is basically an IOU between a borrower (the government or corporation issuer) and a lender (the purchaser). As with a loan, the bond issuer agrees to repay the principal on a predetermined schedule and make interest payments along the way.
A bond can be bought and sold like a stock; therefore it has a market price. So, the two components of a bond are its value (market price) and its income return (interest payments).
Many factors can affect a bond’s price, including its duration (sensitivity to small interest rate changes) and the reliability of the issuer. For example, bonds with a higher risk of default are called junk bonds and have a higher return as a result.
Another significant factor in the price of a bond is a change in interest rates. When a high-quality bond is issued, its return will be in line with current interest rates. For example, let’s say a bond was issued when rates were at 2%. When the Fed raises interest rates to 2.25%, that 2% return becomes less attractive. After all, you can buy new bonds with higher returns. In turn that original bond’s price drops until its return reflects the new higher rate.
Here’s how that would work with a 10-year bond worth $100 that pays 2%. Interest rates rise to 2.25%. That bond will drop to $80 in value, because at that lower price $100 worth will now pay 2.25%.
This teeter-totter effect tends to balance out the loss in market value. Of course, like stocks, you only realize a loss when you sell a bond.
Bonds have this built-in mitigating factor and a predetermined term and return, because of this they tend to be less volatile than stocks. Of course, that lower risk produces lower returns on average. However, when stocks are taking a beating, investors find the relative safety of bonds more attractive, and their prices go up. On the other hand, when stocks are soaring, investors find lower- performing bonds less attractive, and they fall in value.
In general, stocks and bonds tend to move in opposite directions, which makes owning both an attractive tactic in an overall strategy of holding a diverse portfolio. Since the movements of the market are unpredictable, the most prudent strategy is to own instruments that allow you to benefit from unexpected gains, while limiting your exposure to unexpected losses.
The big events that affect the global market are so unpredictable—events like the pandemic, the Great Resignation, and the war in Ukraine. So, it makes sense to follow a plan that’s designed for the long-term.
Who knows what surprises will be in store for investors this next quarter?
But we can be sure that investors who worry less about what they can’t control, and focus more on the things they can, will be much better off in the long run.
Quarterly Market Summary
Index returns
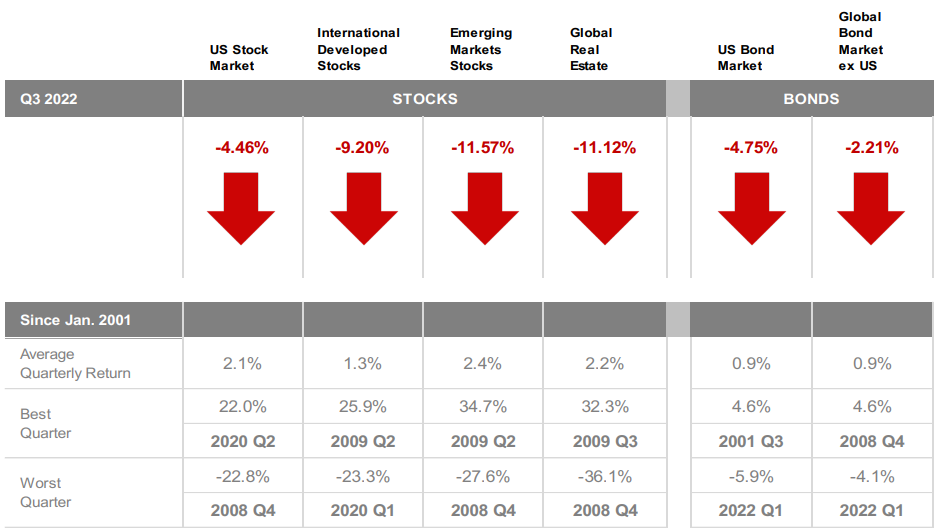
Indexes. MSCI data © MSCI 2022, all rights reserved. Bloomberg data provided by Bloomberg.
Long-Term Market Summary
Index returns as of September 30, 2022
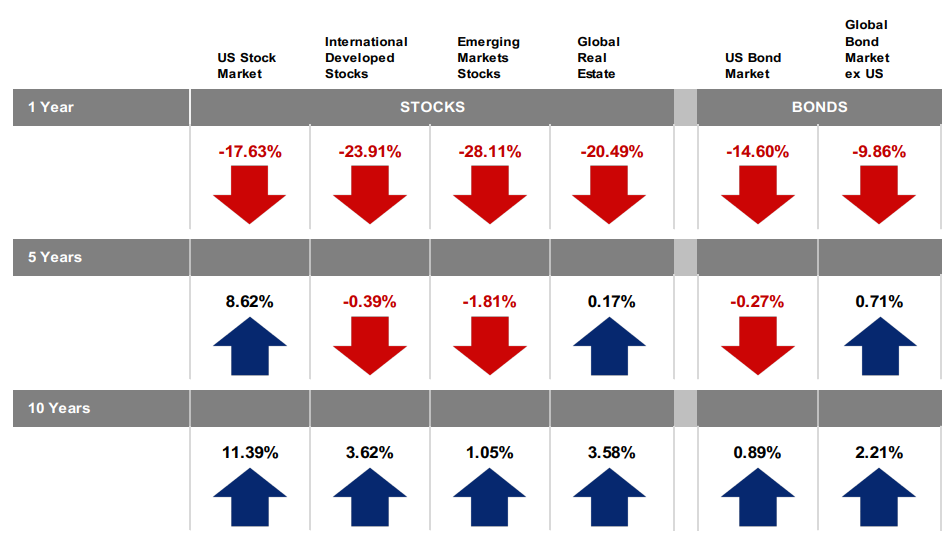
Indexes. MSCI data © MSCI 2022, all rights reserved. Bloomberg data provided by Bloomberg.
World Stock Market Performance
MSCI All Country World Index with selected headlines from Q3 2022
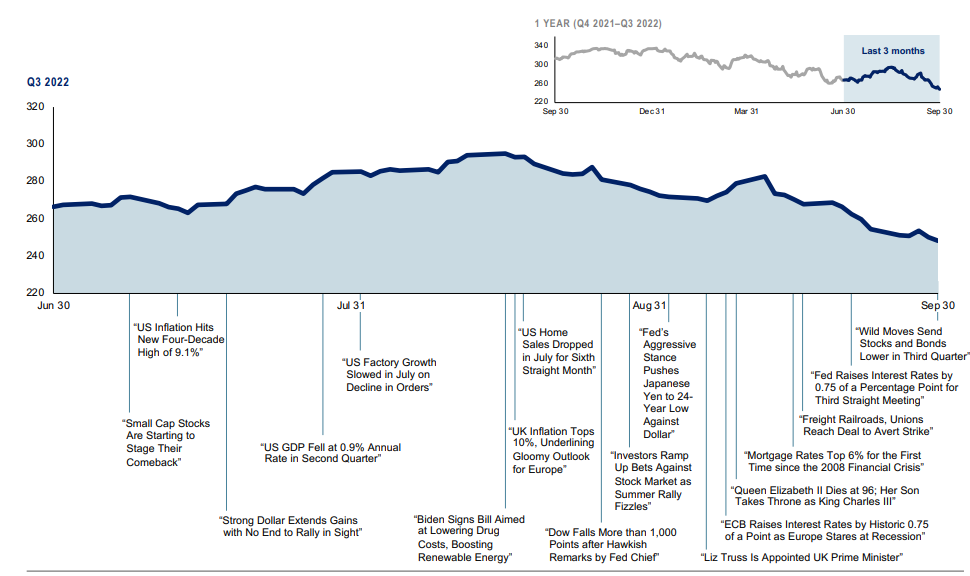
Graph Source: MSCI ACWI Index (net dividends). MSCI data © MSCI 2022, all rights reserved.
It is not possible to invest directly in an index. Performance does not reflect the expenses associated with management of an actual portfolio. Past performance is not a guarantee of future results.
World Stock Market Performance
MSCI All Country World Index with selected headlines from past 12 months
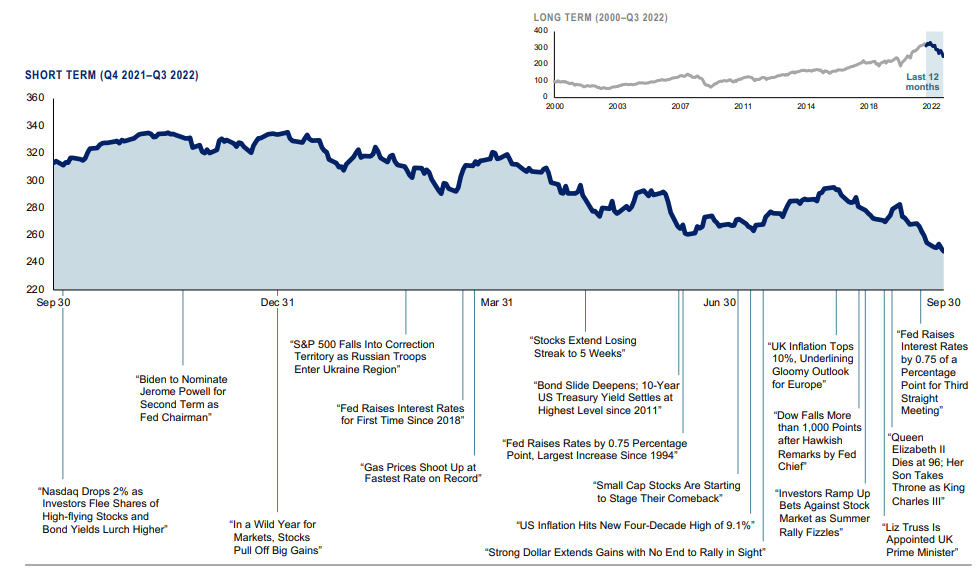
Graph Source: MSCI ACWI Index (net dividends). MSCI data © MSCI 2022, all rights reserved.
It is not possible to invest directly in an index. Performance does not reflect the expenses associated with management of an actual portfolio. Past performance is not a guarantee of future results.
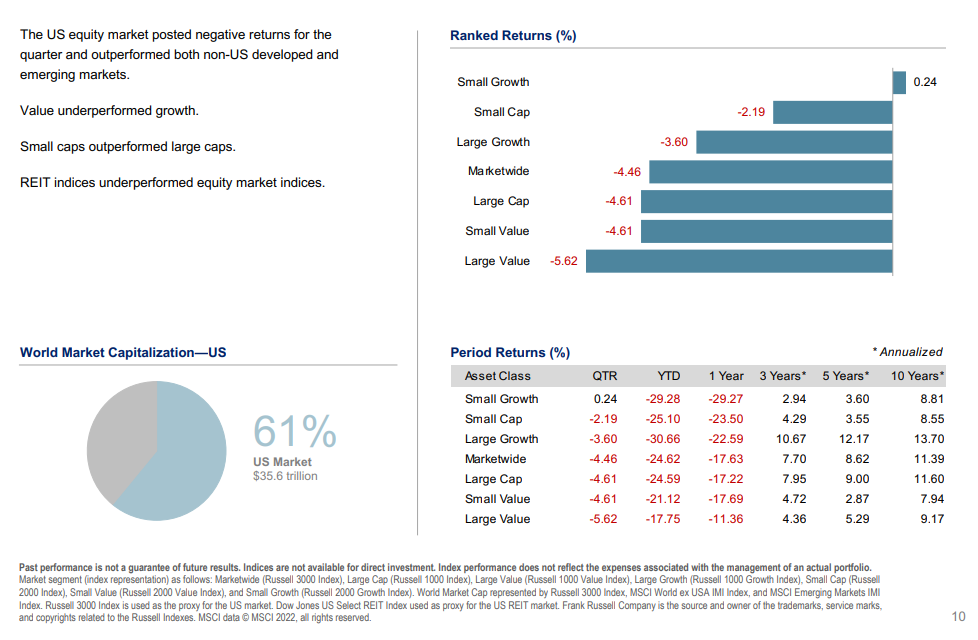
US Stocks
Third quarter 2022 index returns
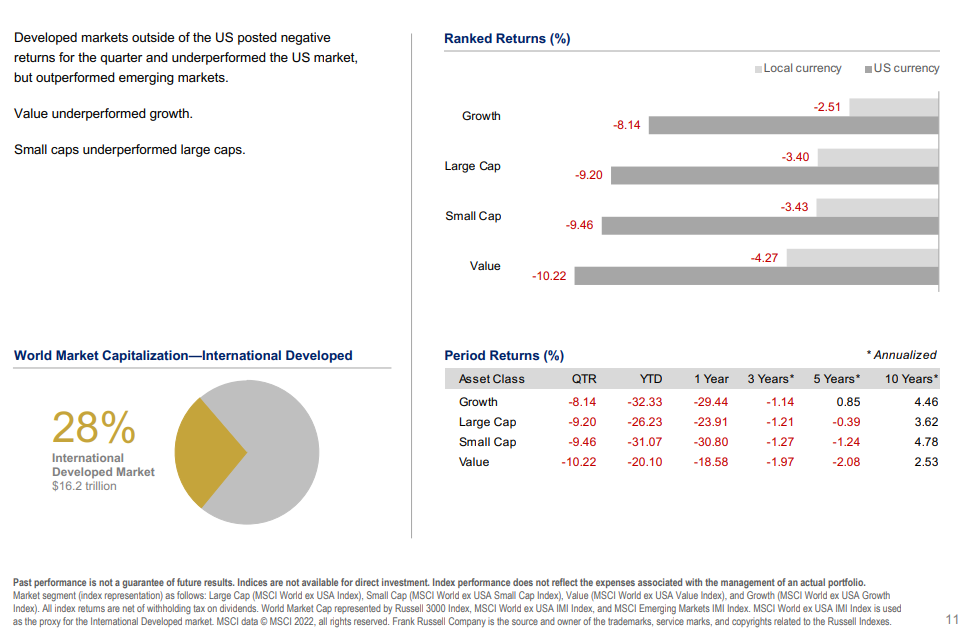
International Developed Stocks
Third quarter 2022 index returns
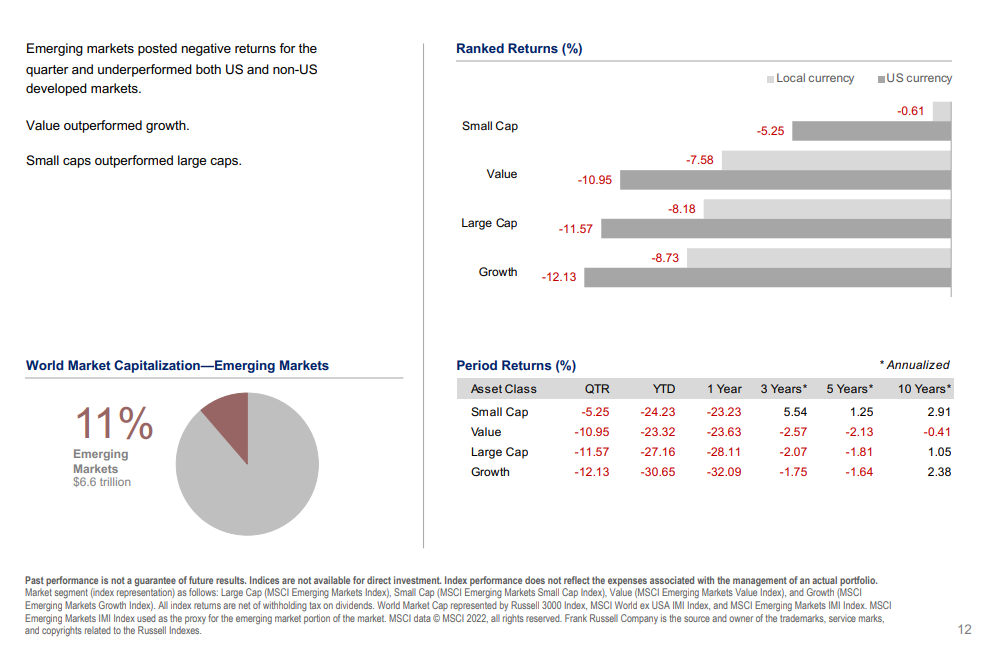
Emerging Markets Stocks
Third quarter 2022 index returns
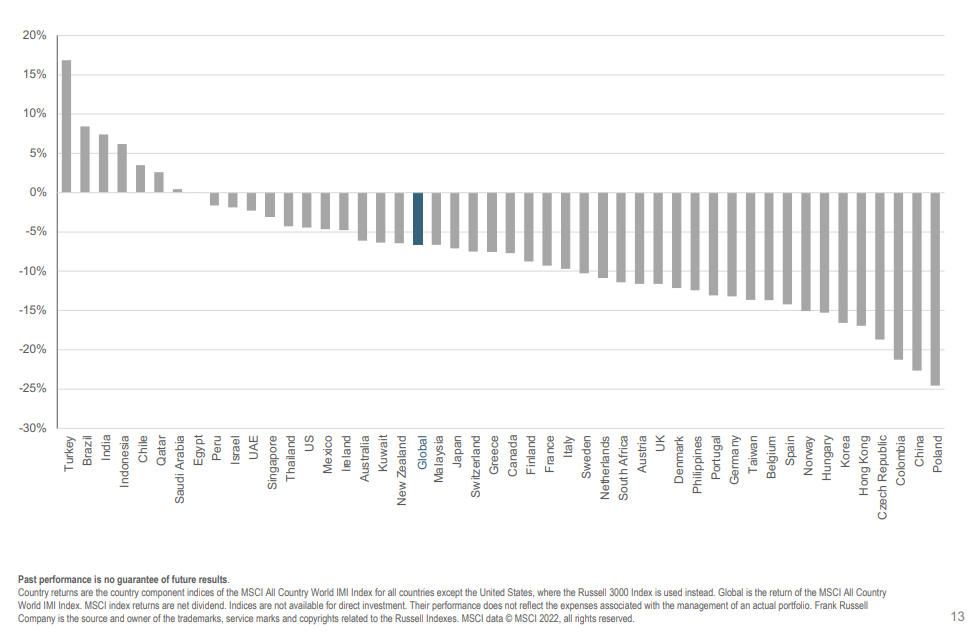
Country Returns
Third quarter 2022 index returns
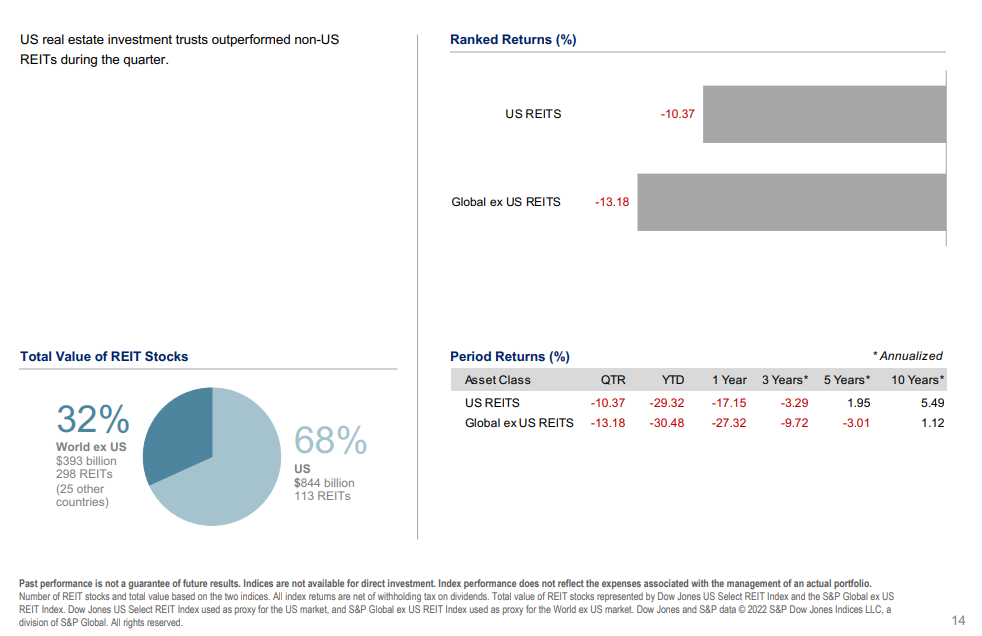
Real Estate Investment Trusts (REITs)
Third quarter 2022 index returns
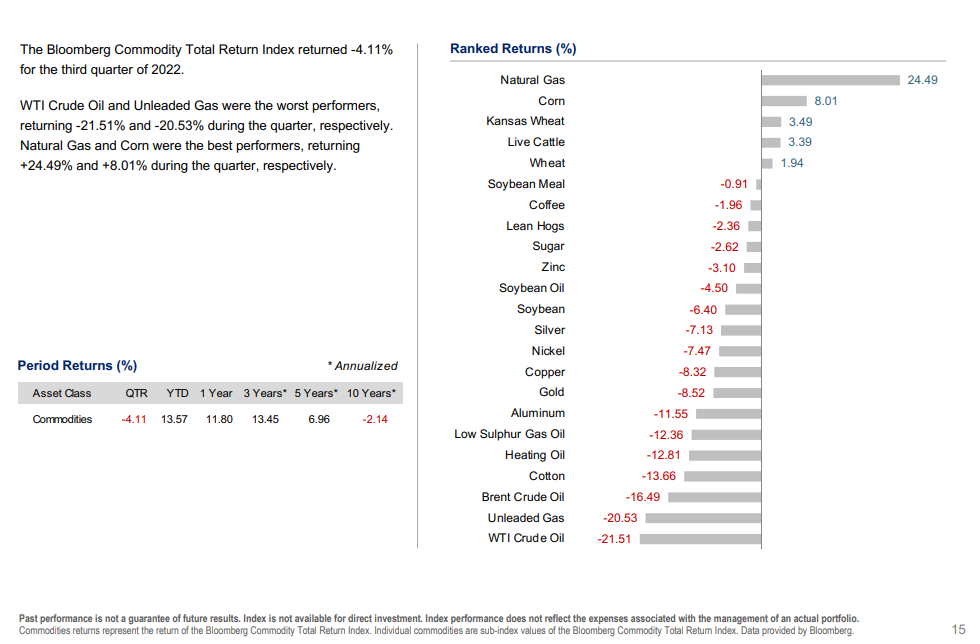
Commodities
Third quarter 2022 index returns
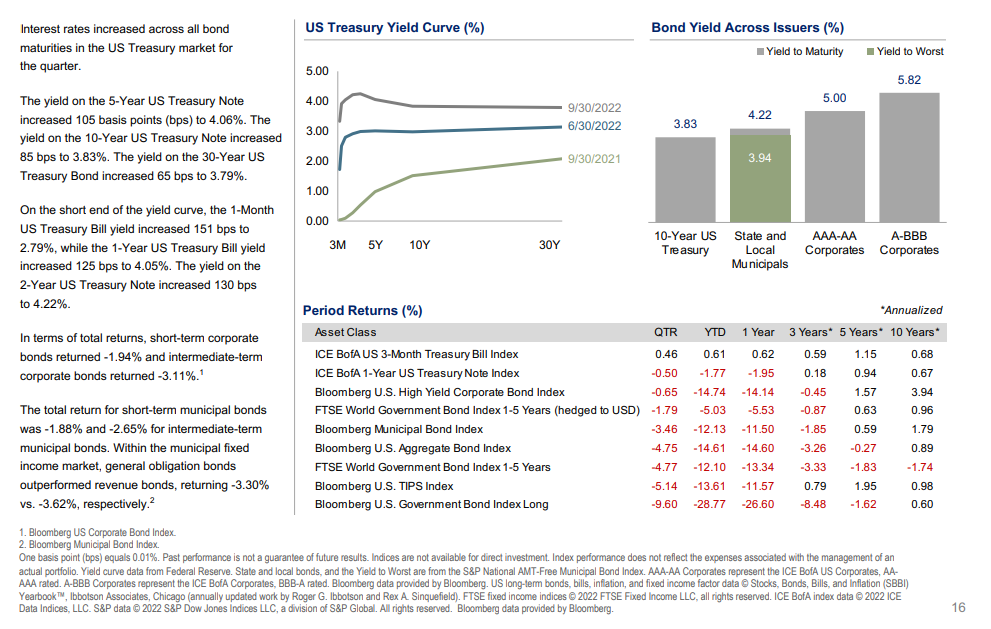
Fixed Income
Third quarter 2022 index returns
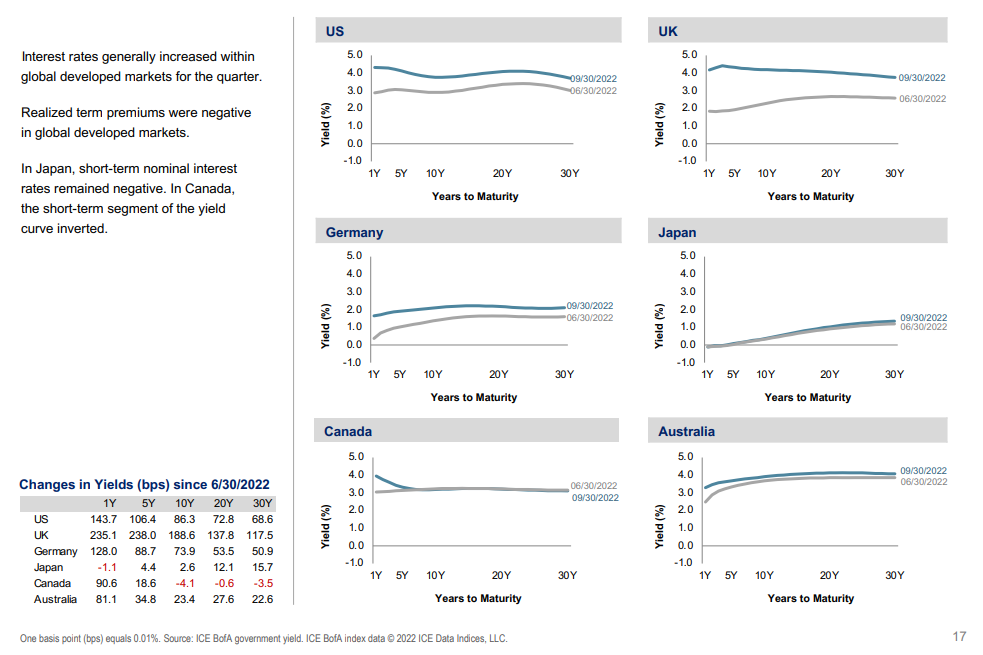
Global Fixed Income
Third quarter 2022 yield curves
What Drives Investment Returns? Start with Ingenuity.
Third quarter 2022
A recent news item reported that Frederick Smith intended to step down as Chairman and Chief Executive Officer of FedEx Corp., the largest air freight firm in the world.
As a Yale undergraduate in 1965, Smith wrote a term paper for his economics course outlining an overnight air delivery service for urgently needed items such as medicines or computer parts. His professor was not much impressed with the paper, but after a stint in the Air Force, Smith sought to put his classroom idea into practice. He founded Federal Express (now FedEx) in 1971, and one evening in April 1973, 14 Dassault Falcon jets took off from Memphis airport with 186 packages destined for 25 cities.
In retrospect, it was not an auspicious time to launch a new venture requiring expensive aircraft consuming large quantities of jet fuel. Oil prices rose sharply later that year following the Arab states’ oil embargo, and the US economy fell into a deep recession. Most airlines struggled during the 1970s, and Federal Express was no exception.
But Smith’s idea found favor with customers, and 49 years after its initial deliveries, the firm is a global colossus with over 650 aircraft, including 42 Boeing 777s—each of which can fly more cargo than 100 Falcons.
Although it took over two years to turn its first profit, FedEx became the first start-up in American history to generate over $1 billion in revenue in less than 10 years without relying on mergers or acquisitions. The journey has proved rewarding for investors as well—100 shares purchased at the initial offering price of $24 in 1978 has mushroomed to 3,200 shares worth over $718,000 as of May 31, 2022.1
Fred Smith’s idea is just one example of ingenuity that humans have exhibited for centuries. Sticks and stones led to hammers and spears, the wheel and axle, the steam engine, and eventually semiconductors and jet aircraft. The invention of writing made it possible to store and hand down information from one generation to the next, enabling ingenuity to compound into an ever-increasing body of knowledge.
Although we often associate innovation with clever new technology, some remarkable developments have required little more than astute powers of observation. The curse of smallpox, for example, has afflicted humans with death or disfigurement for thousands of years. English doctor Edward Jenner noticed that milkmaids who had previously experienced cowpox did not catch smallpox, and in 1796, he took material from a milkmaid’s cowpox sore and inoculated James Phipps, the nine-year-old son of his gardener. Later exposed to the virus, Phipps never developed smallpox, and Jenner published a treatise on vaccination in 1801. Smallpox vaccines gradually eliminated the disease in countries around the world, and the last known case was reported in Somalia in 1977.
- Stock split information sourced from FedEx investor relations website. Stock price information provided by Bloomberg. This is not taking into account cash dividends or any reinvestment.
What Drives Investment Returns?
Start with Ingenuity.
(continued from page 16)
One innovation often paves the way for others:
• Charles Lindbergh took off from Long Island for his historic
transatlantic flight to Paris on May 20, 1927. That same day, J.
Willard Marriott opened a nine-stool lunch counter serving cold A&W
root beer in Washington, D.C. Ten years later he began to supply box
lunches to airlines flying from nearby Hoover airport and 20 years
later opened the world’s first motor hotel in Arlington, Virginia. Today,
Marriott is the world’s leading travel firm, with over 8,000 hotel
properties in 139 countries.
• The now-ubiquitous microwave oven can trace its roots to a happy
accident. While working on radar equipment in 1945 for
Massachusetts-based Raytheon, electronics engineer Percy Spencer
noticed that the chocolate bar in his pocket had suddenly melted. His
curiosity led to the introduction of commercial-grade water-cooled
microwave ovens in 1947 costing thousands and ultimately to
countertop units available today for $99.
• Frustrated by lengthy delays associated with loading and unloading
cargo ships, trucking firm owner Malcolm McLean launched a
shipping service in 1956 using standardized steel containers of his
own design. Met with great skepticism when first introduced, his idea
for theftproof stackable cargo boxes eventually transformed the
global shipping industry—and world trade—by slashing dockside
loading costs over 90%.
• On June 26, 1974, cashier Sharon Buchanan inaugurated the era of
barcode inventory tracking when she scanned a pack of Juicy Fruit
gum bearing a Universal Product Code at Marsh Supermarket in
Troy, Ohio. Barcode scanners eliminated the drudgery and inevitable
mistakes associated with manual entry by checkout clerks and
provided store managers with powerful tools to track sales trends. As
retailers such as Home Depot, Ross Stores, and Walmart expanded
throughout the country in recent decades, barcode technology played
a key role in matching inventory with local preferences at each
location.
• In March 2022, a 20-year-old woman born with a small and
misshapen right ear received a 3D-printed ear implant made from her
own cells and shaped to precisely match her other ear. Although
experimental, the procedure represented a significant advance in
tissue engineering and could eventually lead to artificial organs such
as lungs or kidneys.
The benefits of innovation are widely dispersed throughout the
economy, often in unpredictable ways. Apple Inc. became one of the
world’s most valuable companies based on its clever marriage of the
computer and the telephone; both iPhone users and Apple shareholders
reaped substantial rewards.
On the other hand, suppose your fairy godmother had told you in 1935,
at the dawn of commercial air travel, that this tiny sector of the economy would eventually become a gigantic industry with millions of
passengers flying every year—including some flying from breakfast in
New York to Los Angeles for dinner. What would your prediction be for
industry pioneers such as TWA or Pan American? Most likely, bountiful
prosperity and rewarding stock market performance. The millions of
passengers materialized. The profits did not. Both firms went bankrupt.
So innovation itself does not ensure prosperity in every case.
That’s why it makes sense to diversify. Investors are often tempted to
focus their attention on firms that appear poised to benefit from
innovation. But it’s difficult to predict which ideas will prove successful,
and even if we could, it’s unclear which firms will benefit and to what
extent. Software giant Microsoft has been a big winner for investors,
with the share value soaring more than 100-fold over the 30-year period
ending May 31, 2022. Discount retailer Ross Stores proved even more
rewarding, as the stock price multiplied over 189 times during the same
period. One firm developed powerful computer technology and the other
applied it.
Civilization is a history of innovation—curious minds seeking to improve
upon existing ways of meeting mankind’s wants and needs. Public
securities markets are just one example of such creativity, and they
have a history of rewarding investors for the capital they supply to fund
such innovation. But a significant fraction of the wealth created in public
equity markets typically comes from only a small number of firms;
therefore, we believe owning a broad universe of stocks is the most
effective way to participate in the rewards of ingenuity and innovation,
wherever and whenever it takes place.
Investments involve risks. The investment return and principal value of an investment may fluctuate so that an investor’s shares, when redeemed, may be worth more or less than their original value. Past performance
is not a guarantee of future results. There is no guarantee strategies will be successful.
Named securities may be held in accounts managed by Dimensional. This information should not be considered a recommendation to buy or sell a particular security. The information in this material is intended for the recipient’s
background information and use only. It is provided in good faith and without any warranty or representation as to accuracy or completeness. Information and opinions presented in this material have been obtained or derived from
sources believed by Dimensional to be reliable, and Dimensional has reasonable grounds to believe that all factual information herein is true as at the date of this material. It does not constitute investment advice, a recommendation, or
an offer of any services or products for sale and is not intended to provide a sufficient basis on which to make an investment decision. Before acting on any information in this document, you should consider whether it is appropriate for
your particular circumstances and, if appropriate, seek professional advice. It is the responsibility of any persons wishing to make a purchase to inform themselves of and observe all applicable laws and regulations. Unauthorized
reproduction or transmission of this material is strictly prohibited. Dimensional accepts no responsibility for loss arising from the use of the information contained herein. This material is not directed at any person in any jurisdiction
where the availability of this material is prohibited or would subject Dimensional or its products or services to any registration, licensing, or other such legal requirements within the jurisdiction. “Dimensional” refers to the Dimensional
separate but affiliated entities generally, rather than to one particular entity. These entities are Dimensional Fund Advisors LP, Dimensional Fund Advisors Ltd., Dimensional Ireland Limited, DFA Australia Limited, Dimensional Fund
Advisors Canada ULC, Dimensional Fund Advisors Pte. Ltd., Dimensional Japan Ltd. and Dimensional Hong Kong Limited. Dimensional Hong Kong Limited is licensed by the Securities and Futures Commission to conduct Type 1
(dealing in securities) regulated activities only and does not provide asset management services. Dimensional Fund Advisors LP is an investment advisor registered with the Securities and Exchange Commission.
Investment products: • Not FDIC Insured • Not Bank Guaranteed • May Lose Value
Dimensional Fund Advisors does not have any bank affiliates
Disclosures
Efficient Advisors, LLC (“Efficient”) is an SEC-registered investment adviser
that provides discretionary asset management to individuals, corporations, and trusts. Registration neither implies an endorsement by the SEC nor connotes a specific level of skill or training. Efficient uses exchange traded funds (ETFs) and mutual funds to provide globally diversified, structured investment portfolios to its clients. The information presented here has not been approved or verified by the United States Securities and Exchange Commission or by any state securities authority.
Please note that the models discussed in the presentation are designed to illustrate the benefits of global diversification and do not represent actual Efficient Advisors’ portfolios. Investors should carefully consider the investment objectives, risks, charges and expenses of the Efficient Advisors’ Portfolios prior to investing. This and other important information about Efficient can be found in Efficient’s Disclosure Brochure and at www.adviserinfo.sec.gov. All investments involve risk, including the loss of principal. Past performance is not a guarantee of future results. Investments in securities are subject to volatility, or in other words, subject to rapid or unexpected changes. Future performance may be less than, equal to, or greater than past performance. An investor and his financial advisor should discuss risk, volatility and possible ways to lower exposure to risk and volatility. Risk can be systematic, also known as market risk, and nonsystematic. Systematic risk affects the economy and securities markets as a whole. Systematic risk includes risk such as liquidity risk, inflation risk, interest-rate risk, and sociopolitical risk.
Nonsystematic risk is linked to investment in a particular industry sector or company. Types of nonsystematic risk include management risk and credit risk. ETFs and mutual funds are designed to mitigate systematic and nonsystematic risk by diversification, but remain subject to these risks. ETFs and mutual funds will have similar risks as well as other risks, such as investment management strategy risk. In Efficient’s managed portfolios, Efficient attempts to mitigate these risks by broadly diversifying the allocation across multiple asset classes of stocks and bonds, in both the US domestic and International markets. Efficient applies a disciplined, long-term, structured investment methodology and does not react to the emotional temptation to alter allocations due to short-term market volatility.
Performance and benchmark results are provided exclusively for illustrative purposes. The hypothetical results shown were achieved by means of back testing a hypothetical portfolio of representative indices for each asset class. The results assume annual rebalancing of the portfolios, the reinvestment of dividends and capital gains. The performance results do not reflect the deduction of transaction fees or custodial charges. Management fees are also excluded, unless specifically denoted, since this is a hypothetical illustration using indexes to demonstrate the benefits of diversification and does not represent actual Efficient Advisors portfolios. For information about the fees and expenses for Efficient’s portfolios, please review Efficient’s Disclosure Brochure.
Hypothetical performance results have certain inherent limitations. Hypothetical results are designed with the benefit of hindsight. For reasons including variances in portfolio account holdings (including the amount invested in cash), variances in the investment management fee incurred, market fluctuation, the date on which a client initiates an investment strategy, and any account contributions or withdrawals, the actual performance experienced by an investor may vary substantially from the indicated hypothetical performance results. Comparisons to benchmarks have limitations because benchmarks have volatility and other material characteristics that may differ from the portfolio(s) shown. Also, performance results for benchmarks do not reflect payment of investment management/incentive fees and other fund expenses. Because of these differences, benchmarks should not be relied upon as the sole measure of comparison. Unlike an actual performance record, simulated results do not represent actual trading. The results may under- or over compensate for the impact of various market and economic factors such as systematic and nonsystematic risk. No representation is being made that any account will or is likely to achieve future profits or losses similar to those shown. Investors should not assume that investment decisions Efficient makes in the future will be profitable or equal the investment performance of the past. Past performance does not indicate future results. You cannot invest directly in an index.